Does AI Content Rank on Google? Results from Six Sites
Six Search Console snapshots show about 1.64M impressions across different periods. See the results, what they can establish and how to measure AI content properly.

By Di Reshtei, Co-founder of OmevAI · X
Published · Updated
6
site snapshots
~1.64M
impressions
~3.45K
clicks
Can AI-generated content rank on Google?
Yes, AI-generated content can rank on Google. Google says appropriate use of AI is allowed and does not give a page a special ranking advantage. The useful question is whether the finished page offers an original, reliable answer that deserves attention. See Google's guidance on AI-generated content.
Our six-site case provides a more limited observation: the published Search Console snapshots record search visibility and clicks for sites where we reported publishing AI-generated pages. Together, the displayed values add up to about 1.64 million impressions and 3.45 thousand clicks, across different time windows.
Those totals do not isolate traffic to the generated pages. They also do not tell us whether visitors became customers. Use this case to understand the measurement problem before deciding how much content to produce.
What we published and what the evidence covers
Our original account described six SaaS and ecommerce sites, with up to 200 AI-generated pages per site, published gradually using Omev Lite and Pro. It reported no human editing of those pages, no dedicated link-building campaign and no ongoing optimization during the observation period. That is the publisher-reported setup; Search Console screenshots cannot verify those production details.
The evidence available in this article is six anonymized screenshots, labeled A–F. They contain aggregate performance cards and daily charts. They do not include the page list, an export filtered to the generated URLs, a publication log or a matched group of human-written pages.
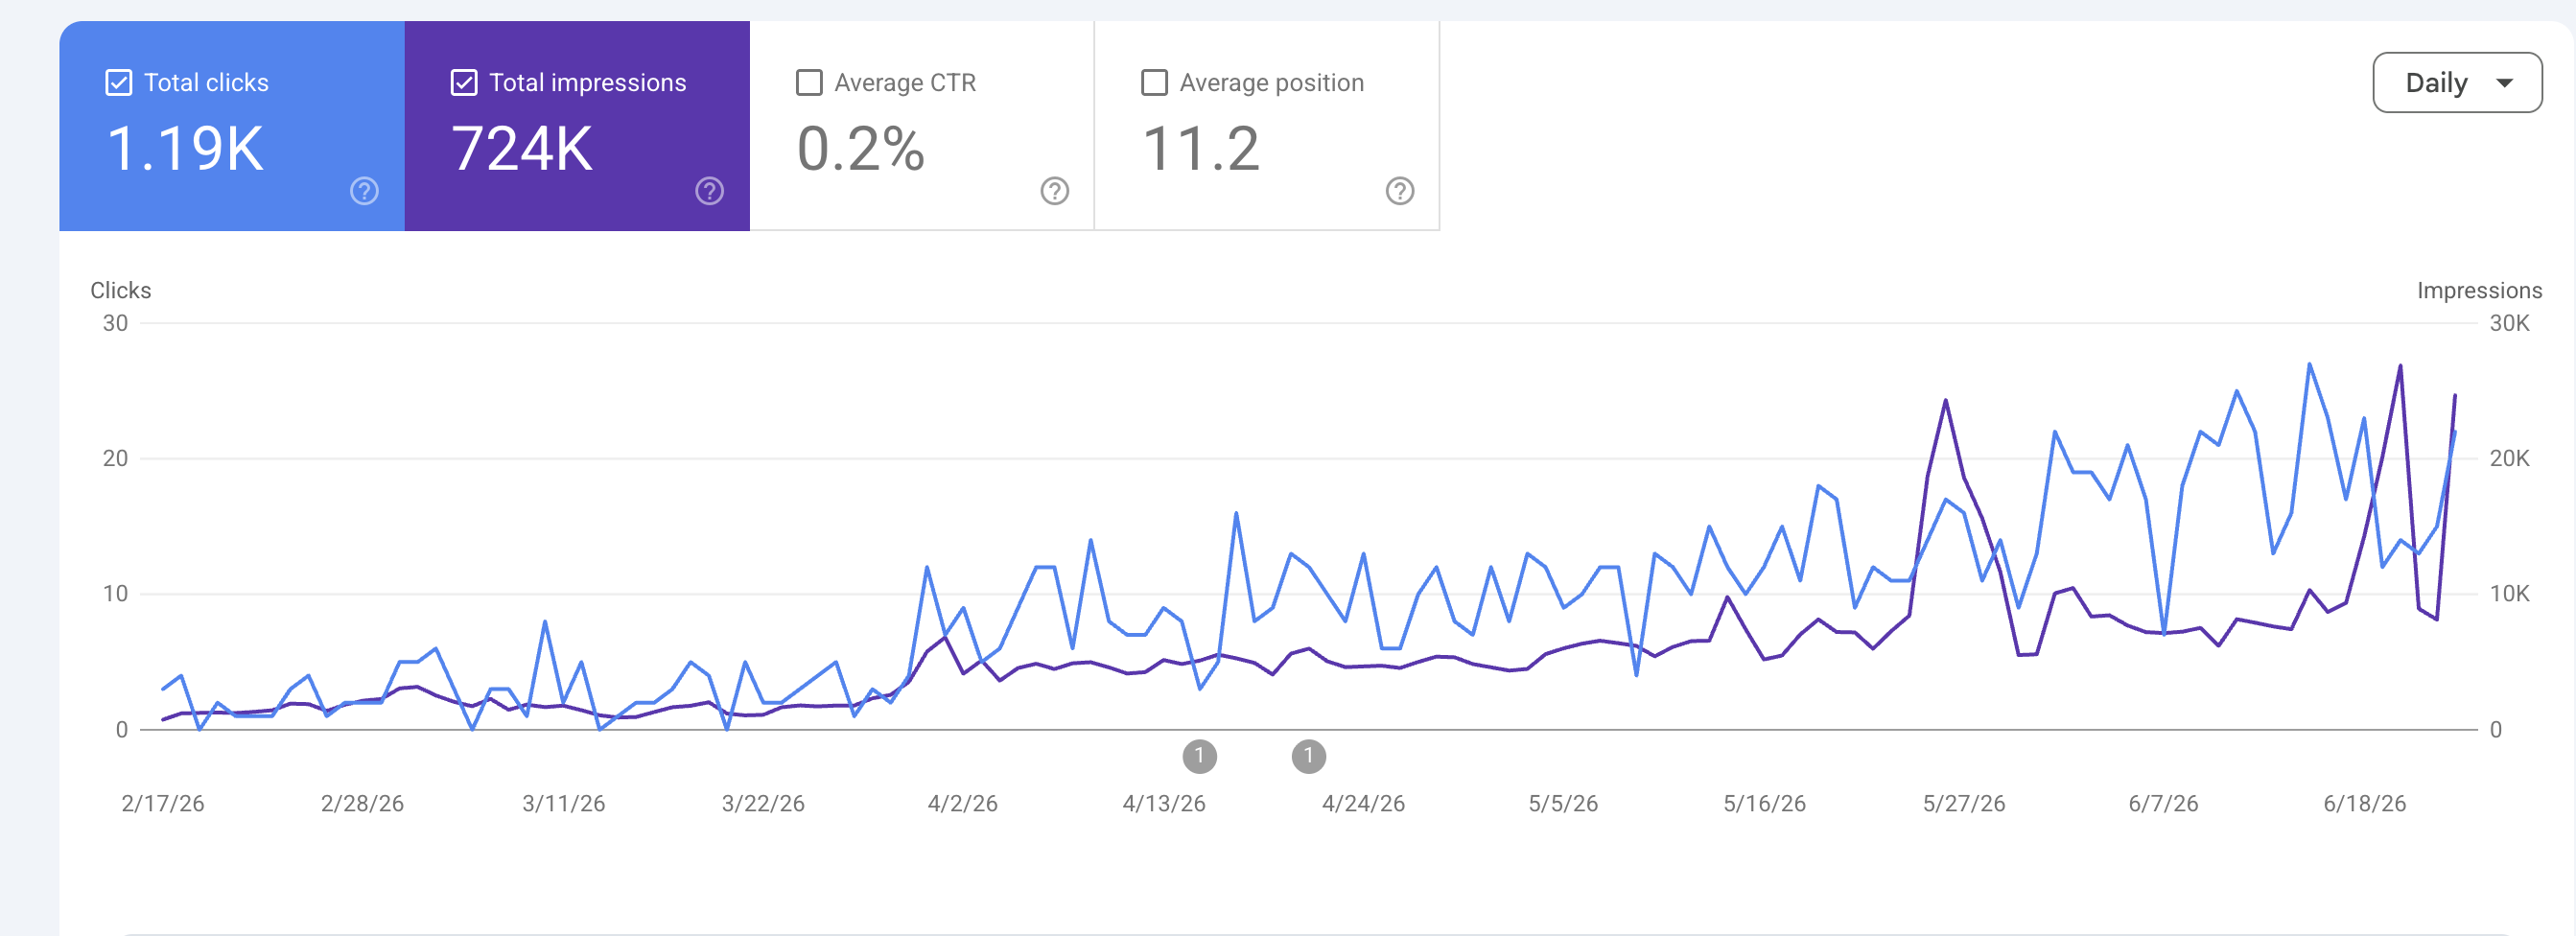
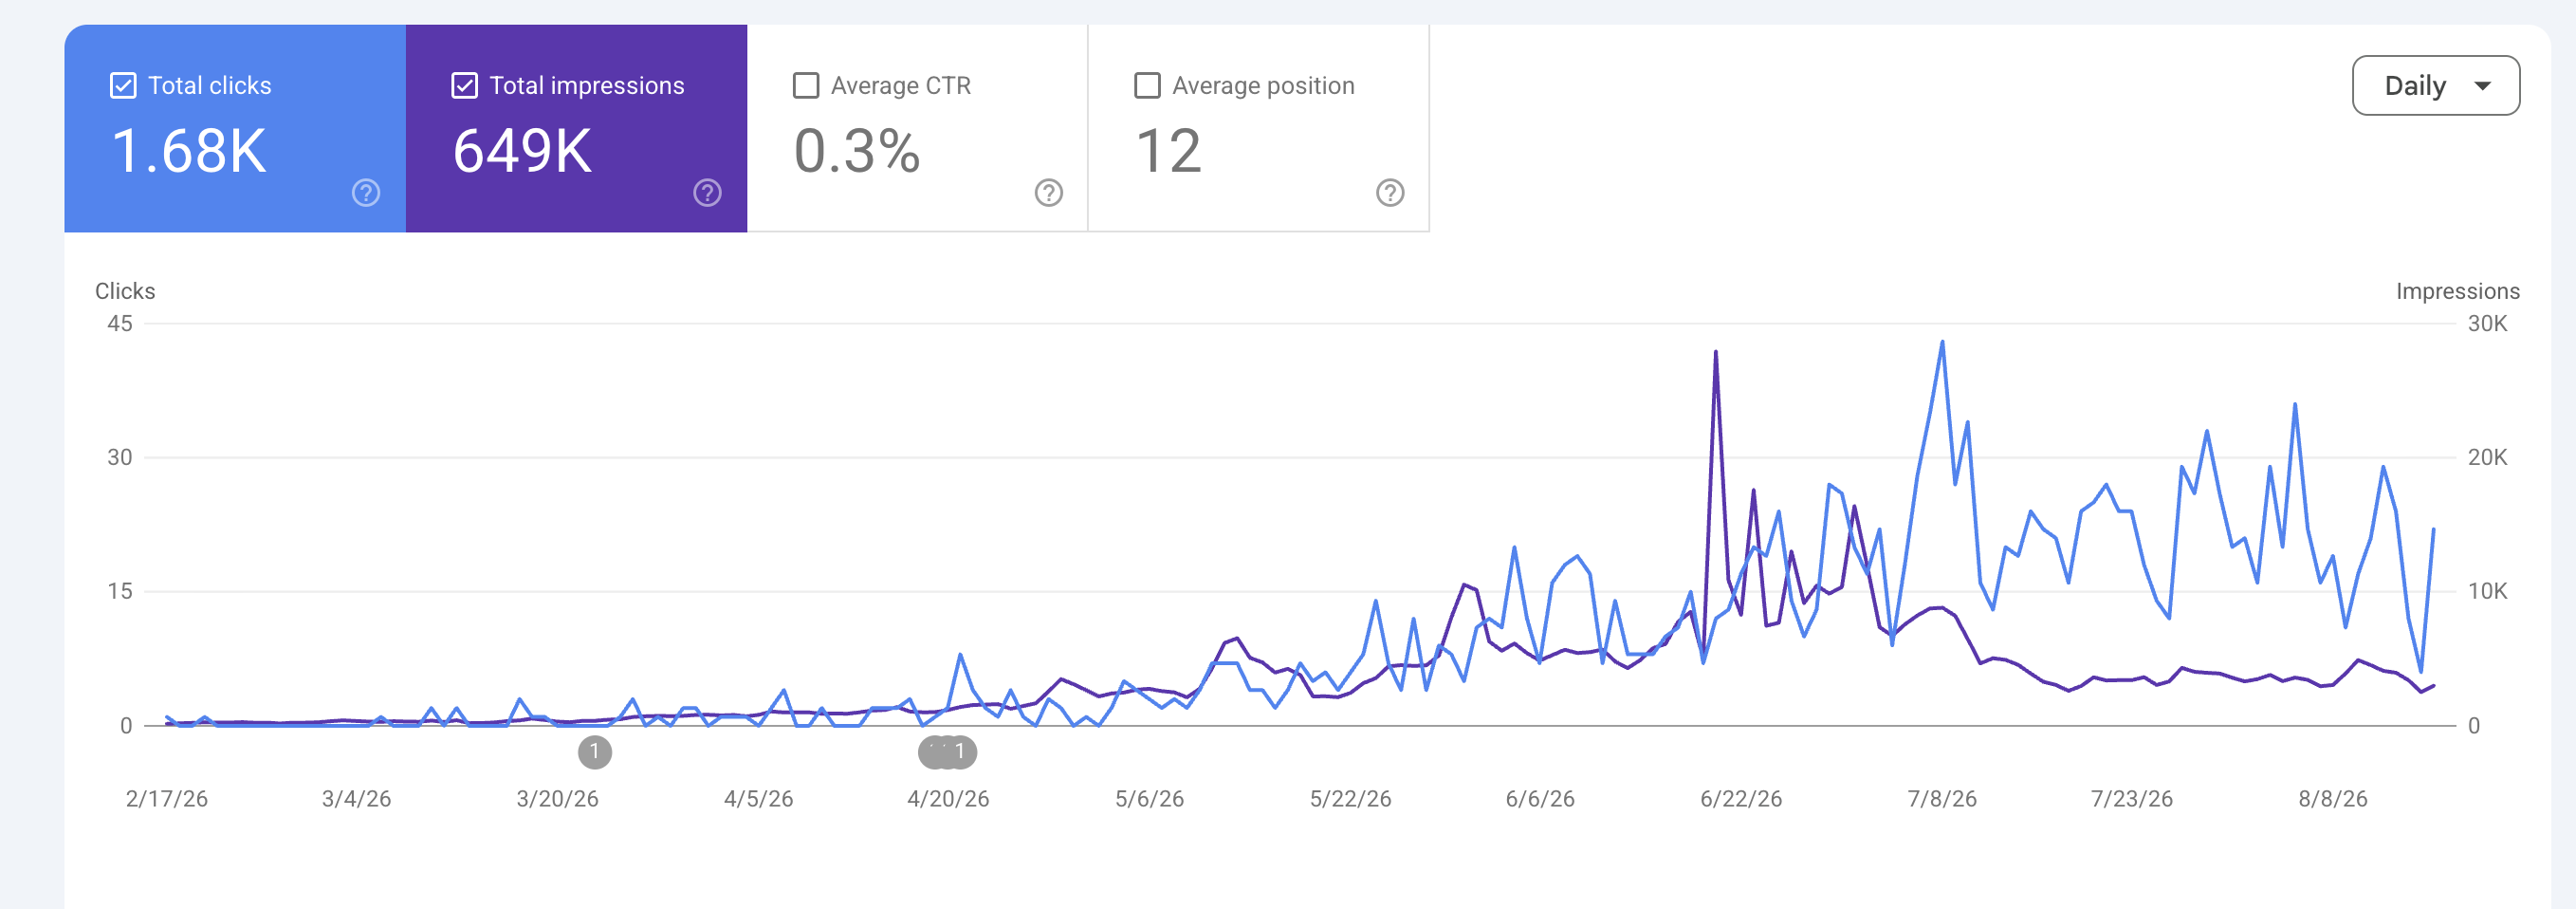
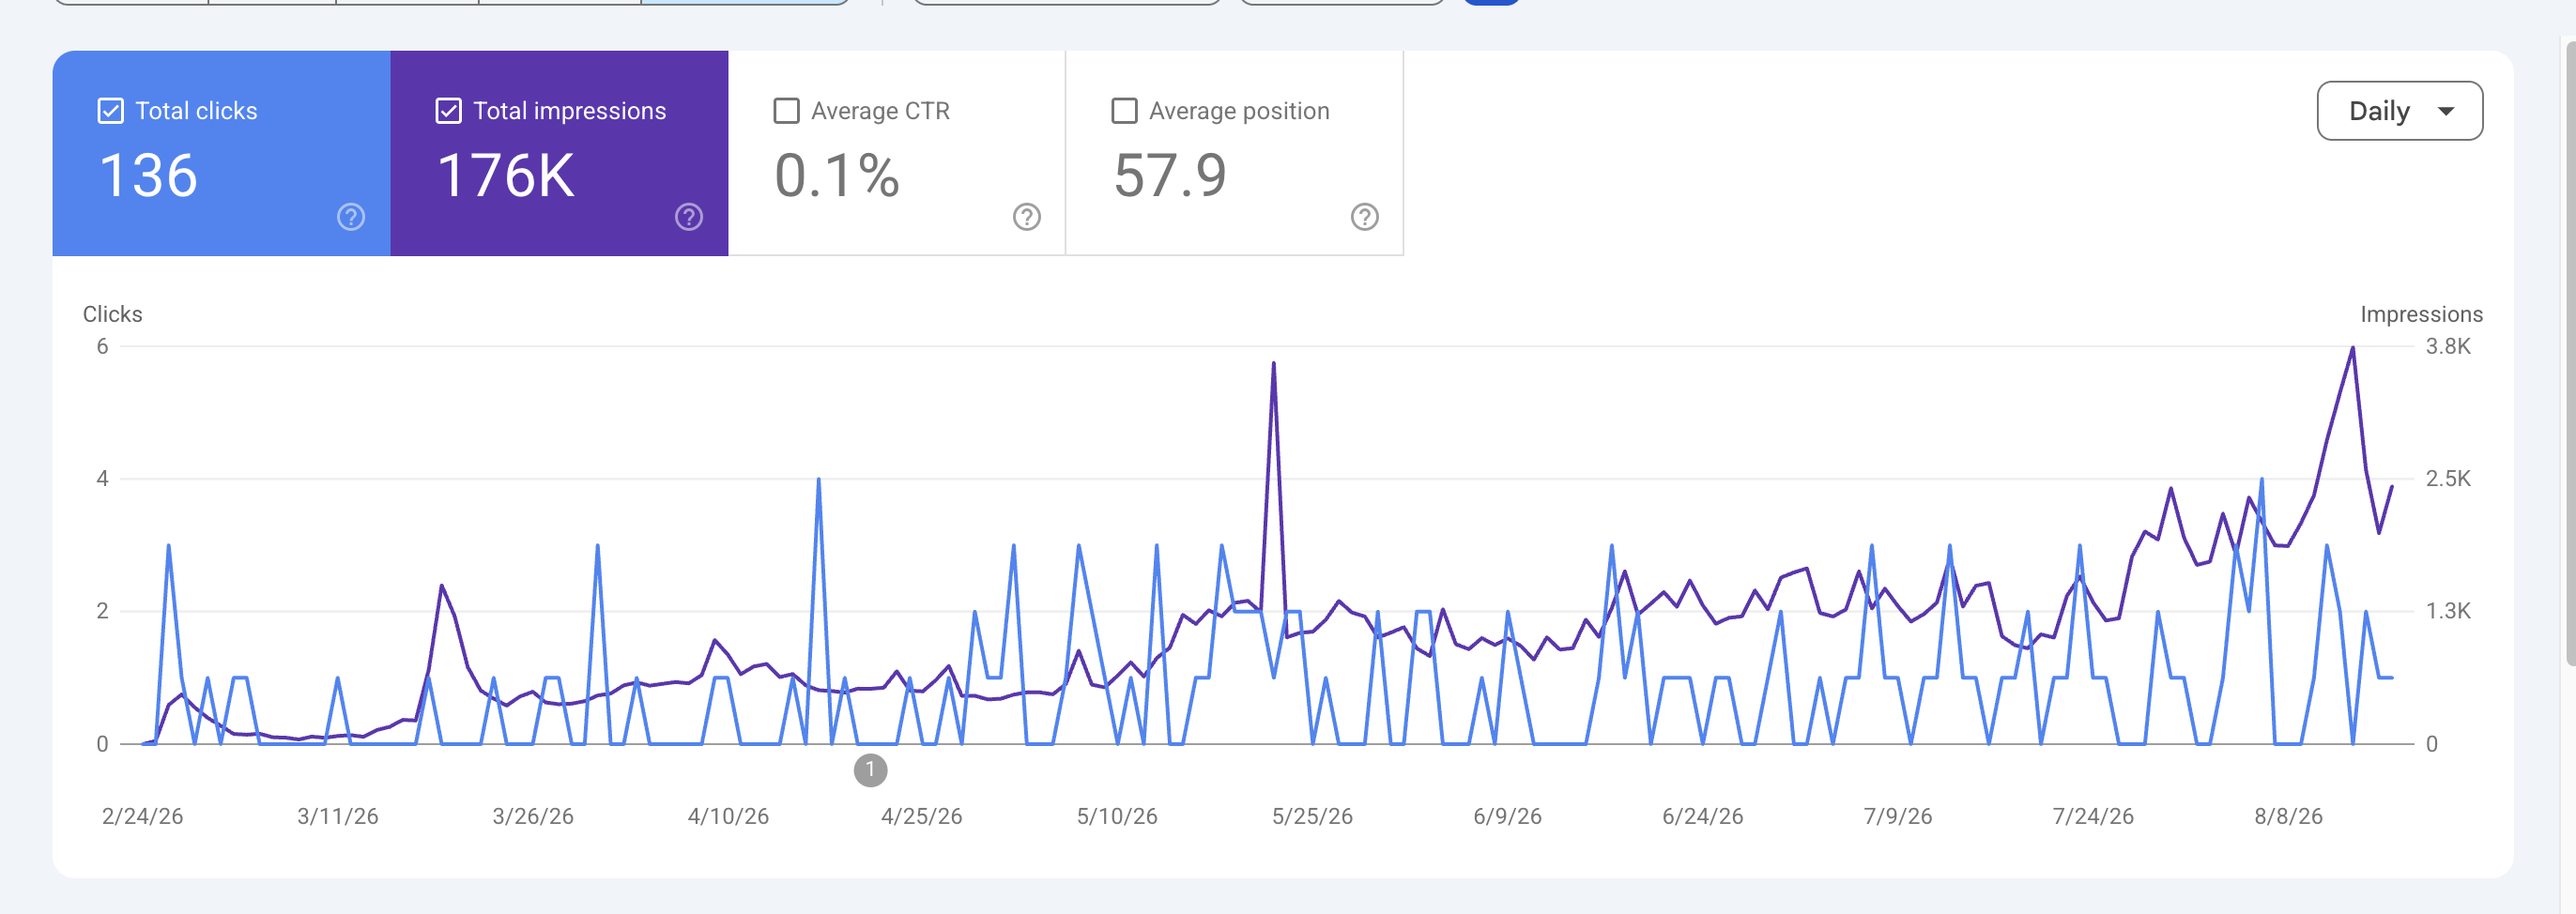
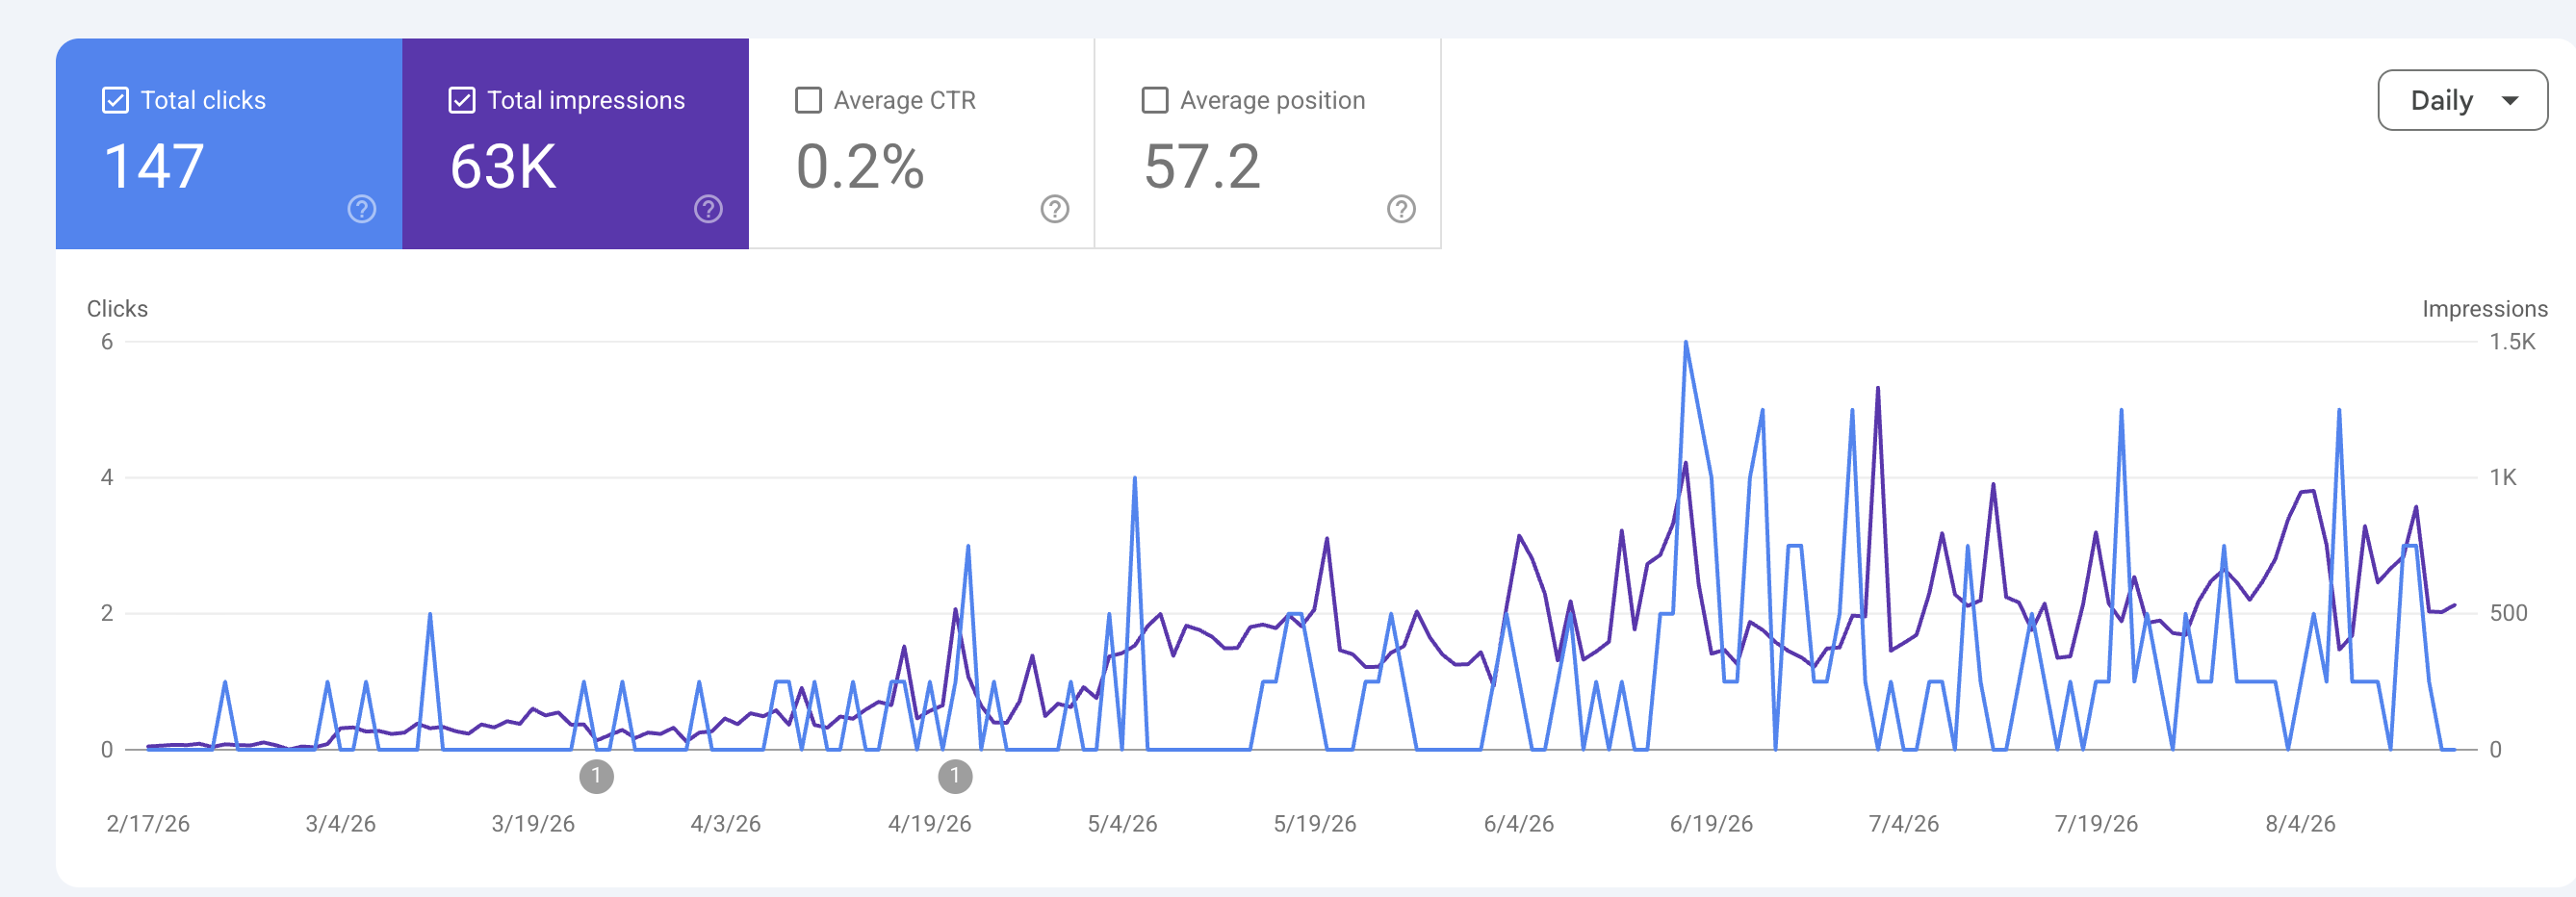
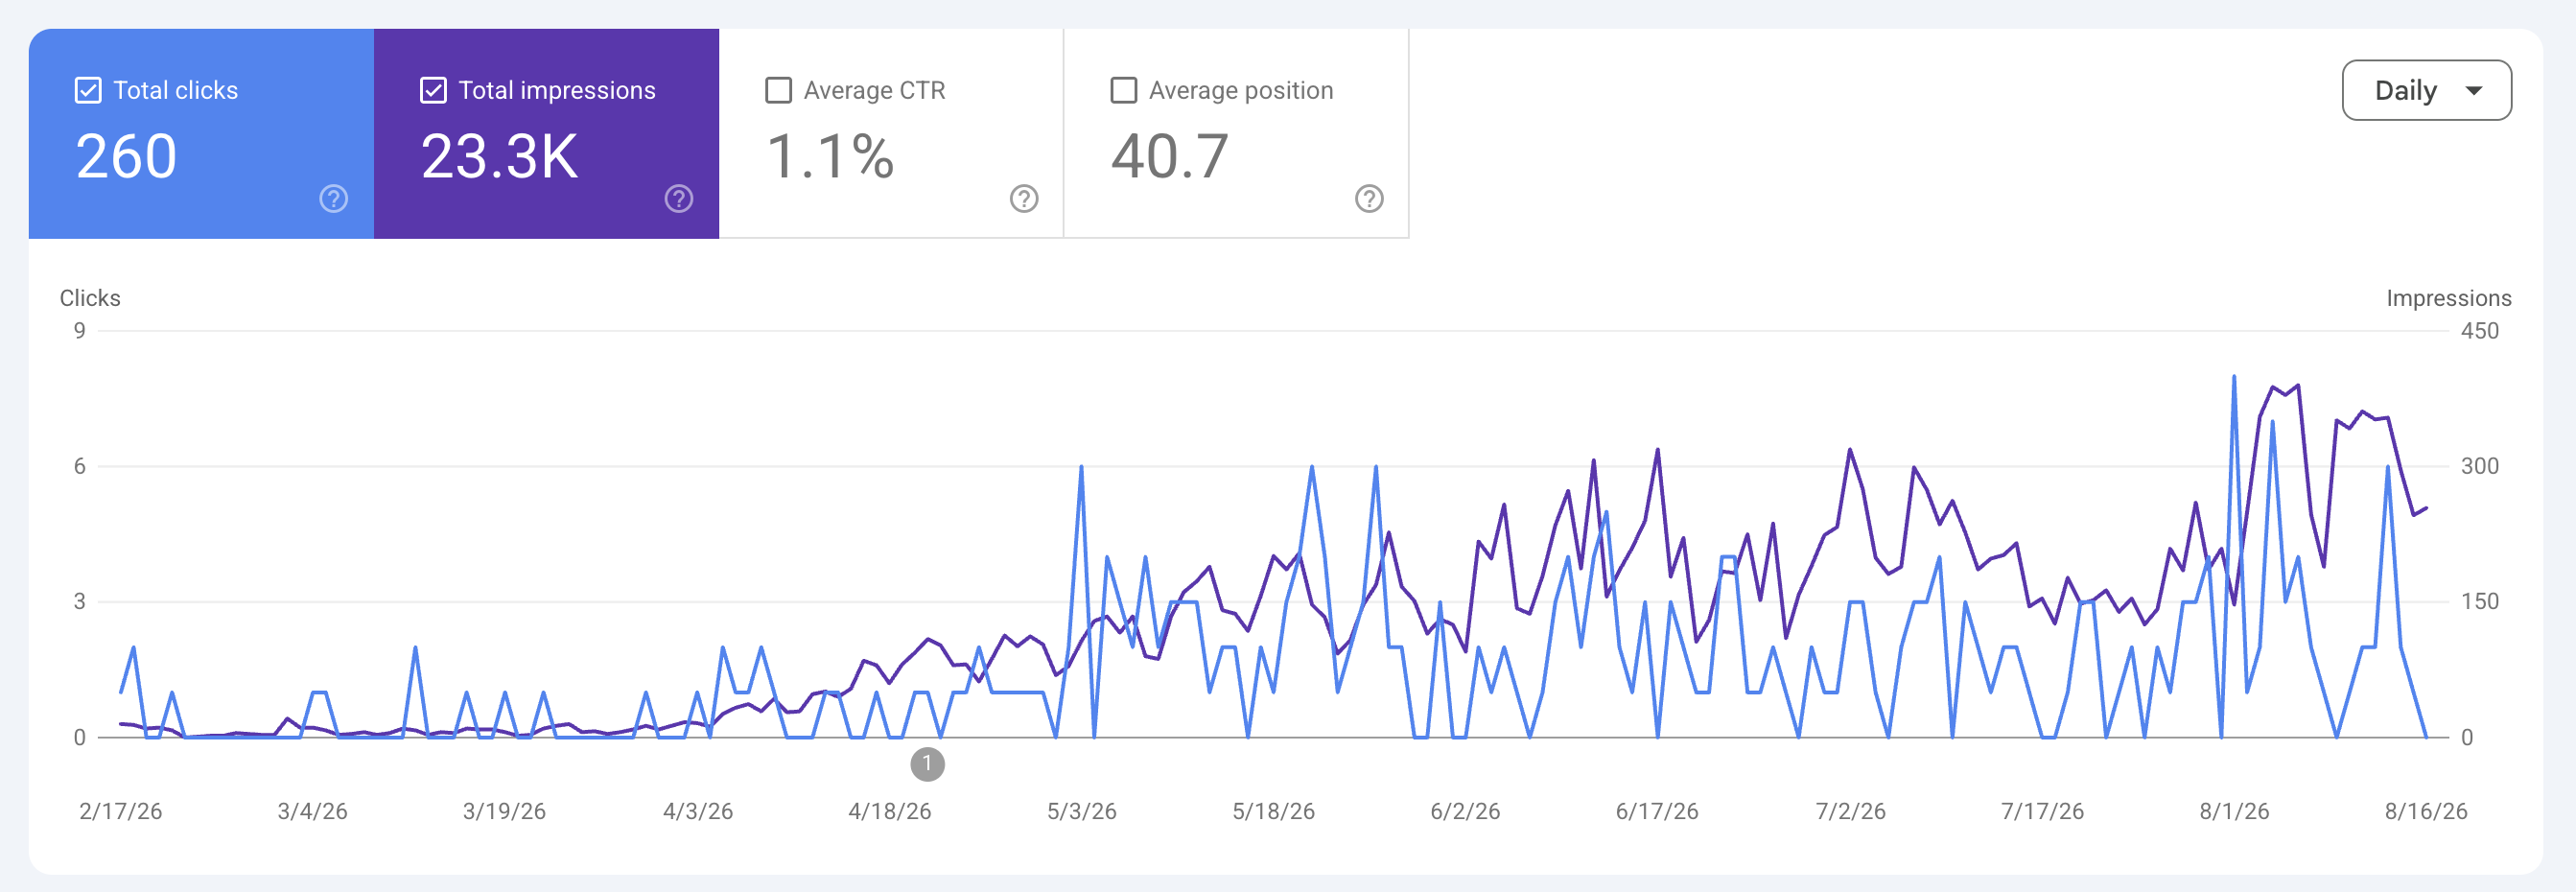
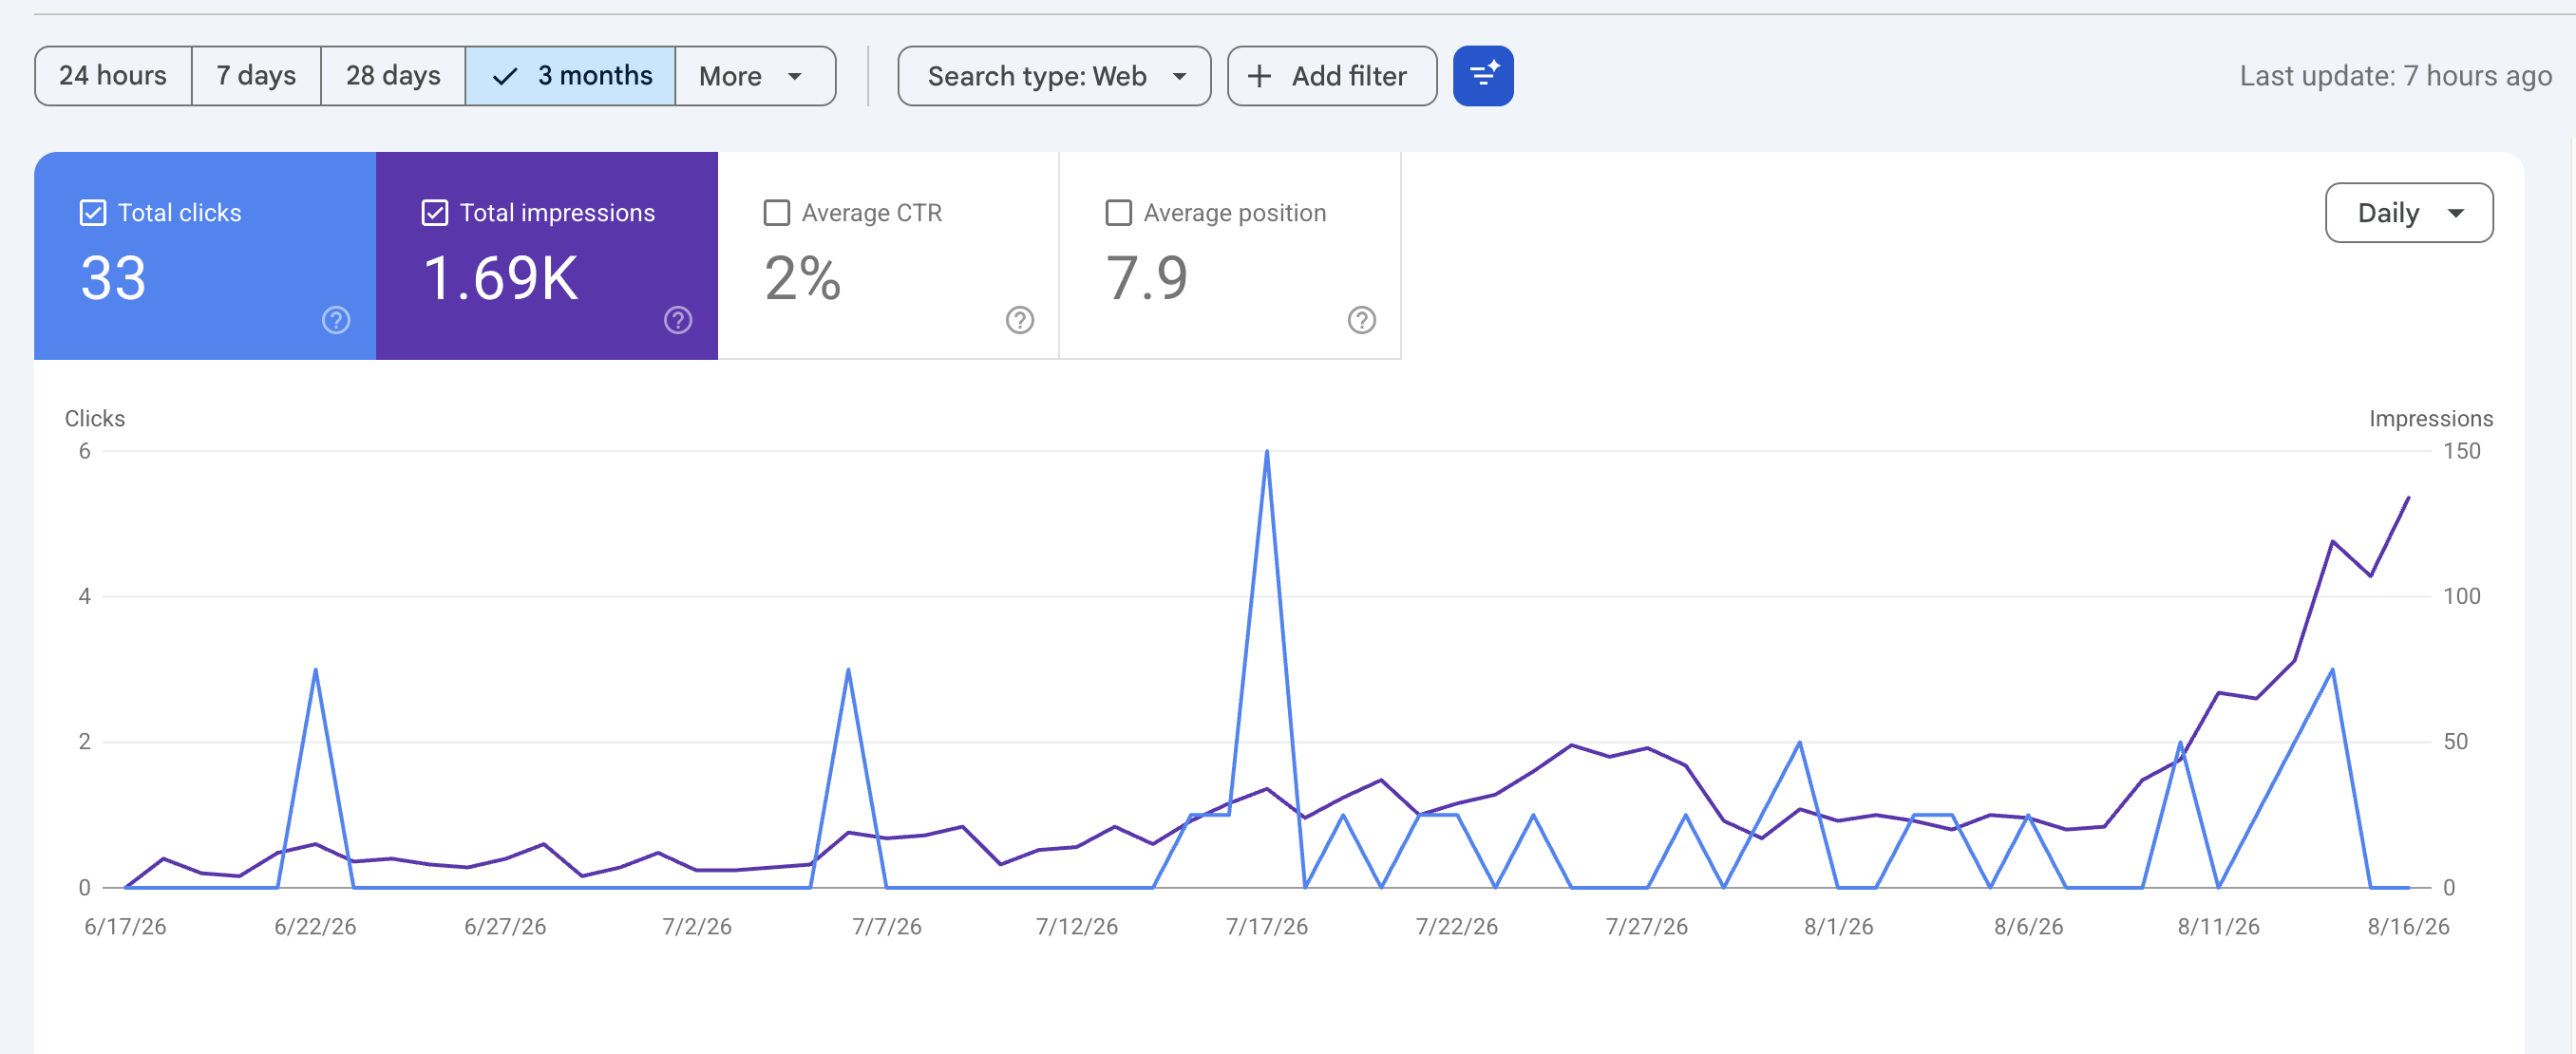
The chart windows also differ. Site A shows February to June 2026; B–E show roughly February to August. Site F has “3 months” selected, but its plotted dates run from June 17 to August 16. We keep those distinctions instead of presenting every site as a six-month experiment.
This September 11 update revisits the existing screenshots. It adds no new Search Console observations. The maximum reported inventory would be 1,200 pages across six sites, but the exact published count is unavailable here. We therefore do not calculate clicks per article or a cost per published page.
The six-site results at a glance
The table transcribes the metric cards as displayed. K means thousand; those abbreviated counts are rounded. CTR and average position are copied from the cards, rather than recalculated to suggest greater precision.
| Site | Impressions | Clicks | CTR | Avg. position |
|---|---|---|---|---|
| A | 724K | 1.19K | 0.2% | 11.2 |
| B | 649K | 1.68K | 0.3% | 12 |
| C | 176K | 136 | 0.1% | 57.9 |
| D | 63K | 147 | 0.2% | 57.2 |
| E | 23.3K | 260 | 1.1% | 40.7 |
| F | 1.69K | 33 | 2% | 7.9 |
Adding the displayed counts gives approximately 1.64M impressions and 3.45K clicks, across unequal windows, with a combined click-to-impression ratio of about 0.21%. This is a descriptive sum across unequal windows, not an aligned monthly or six-month performance benchmark.
Sites A and B account for approximately 84% of those impressions and 83% of those clicks. That concentration is visible in this set; it does not establish a distribution to expect across another portfolio.
Site F has the highest displayed CTR and the lowest average-position number, alongside just 33 clicks. Site C has many more impressions but 136 clicks. These differences are reasons to inspect the underlying queries and pages, not evidence that one site's strategy is better.
What the numbers tell us—and what they cannot
Search visibility is not the same as business value
Each screenshot records impressions and clicks. Without the generated URL list and matching page-level data, we cannot assign every count to AI content or measure how much of the intended inventory was indexed. The available evidence also contains no leads, sales or revenue.
Average position is not a page-number label
Search Console's metric definitions explain that average position summarizes positions across impressions and uses the property's topmost result. A value of 11.2 does not mean every page ranks eleventh or sits on page two. A value of 57.9 does not diagnose an intent mismatch. Inspect the individual query and page before deciding what to change.
A low combined CTR does not identify the cause
The approximate 0.21% ratio says how many clicks accompanied the displayed impressions. It does not isolate the effects of titles, topics, brand familiarity, devices or result layouts. In this case, it is a prompt for investigation, not a universal failure threshold.
These screenshots do not compare AI with human writing
There is no matched control group, and the six sites have different contexts and observation periods. We cannot conclude that AI caused the traffic, that unedited output performs as well as edited work, or that a particular model produced better rankings. We also cannot derive a reliable time-to-rank from curves without page publication dates.
The original Search Console screenshots
The six original Search Console images appear below in the A–F order from the table. Each chart uses separate vertical scales for clicks (blue) and impressions (purple). Read the labeled axes, not the relative line heights. Scales also differ between sites.
On smaller screens, scroll each chart horizontally to read its metric cards and dates. The table above keeps all six sets of values available as text.
Site AFebruary–June 2026
Site BFebruary–August 2026
Site CFebruary–August 2026
Site DFebruary–August 2026
Site EFebruary–August 2026
Site FJune 17–August 16 2026
How we would measure the next content run
The next useful test starts with traceable pages and a business goal. These are recommendations for a better evaluation, not changes already tested on the six sites.
- Record the actual article set. Keep the canonical URL, publication date, topic, model and editing status for each page. Separate newly generated pages from the site's existing content.
- Use comparable observation periods. Review groups over a consistent time since publication, and retain the dates and Search Console filters. Check indexing separately rather than inferring coverage from aggregate impressions.
- Review queries and pages together. For relevant queries that generate impressions, inspect the destination page, search intent and current results. Check titles, answers, sources and internal links before choosing an improvement. Change one identifiable element when practical and record the date.
- Track business outcomes. Connect organic landing pages to the conversion events that matter to the business. Keep clicks, analytics visits and attributed conversions distinct, and record the attribution method.
- Count the full production cost. Include generation attempts, fact checking, editing and maintenance. Compare that cost with approved, useful pages and observed outcomes.
For the operating side, our bulk article generation guide covers review capacity and publication checks. The LLM cost optimization guide explains how to include rejected output and editing in the budget.
Before publishing another batch, identify what each page adds for the reader. Google's generative content guidance emphasizes accuracy, quality and relevance, and warns that generating many pages without added value may violate scaled-content rules.
Omev AI · Study publisher
Omev AI: the generation layer in this case

Omev AI supplied the models described in our original account, and Omev AI publishes this case study. This is product context, not an independent model ranking or a controlled demonstration of an SEO advantage.
If your team already owns its content workflow, the Omev SEO content API is a candidate to evaluate for repeatable generation tasks. Test Lite or Pro on representative source material and judge the finished output, required editing and total cost. Your team retains responsibility for sources, approval and publishing.
Keep that evaluation separate from a ranking experiment. A model can help produce a draft; a good draft still needs a useful purpose and a measured result after publication. These six snapshots do not guarantee that a new Omev-generated page will rank or convert.
Use only material you are permitted to submit: self-serve content is used for training without an opt-out and must contain no personal data. The current evaluation offer is $5 credit for 10 days, with no card required. Start with a suitable sample, then decide whether the output fits your workflow.
Questions about AI content and rankings
Does Google penalize content simply because it was generated with AI?
Google's AI content guidance does not treat appropriate AI use as an automatic violation. It also gives AI content no special advantage. Evaluate the page's usefulness and compliance with the applicable content policies.
Did the six sites get 1.64 million impressions from AI articles alone?
The available screenshots do not establish that. Approximately 1.64 million is the sum of the displayed impression counts across six reports with different windows. A generated-URL inventory and matching performance data are needed to measure the article set itself.
Does this case show that unedited AI articles are enough?
No. The original account reports publishing unedited output, but the screenshots do not compare it with reviewed content or establish its factual quality. Review remains a separate publishing responsibility.
How long does AI content take to rank?
This case cannot provide a reliable timeline. The screenshots show calendar dates, but no page-level publication log. Measure the actual URLs from their publication dates and avoid treating a rise in a site-wide curve as a universal waiting period.
Evaluate Omev AI on your own content
Compare the finished output, review effort and cost on a representative task. If you publish the results, track the actual pages and business outcomes separately.
Start your content evaluation →